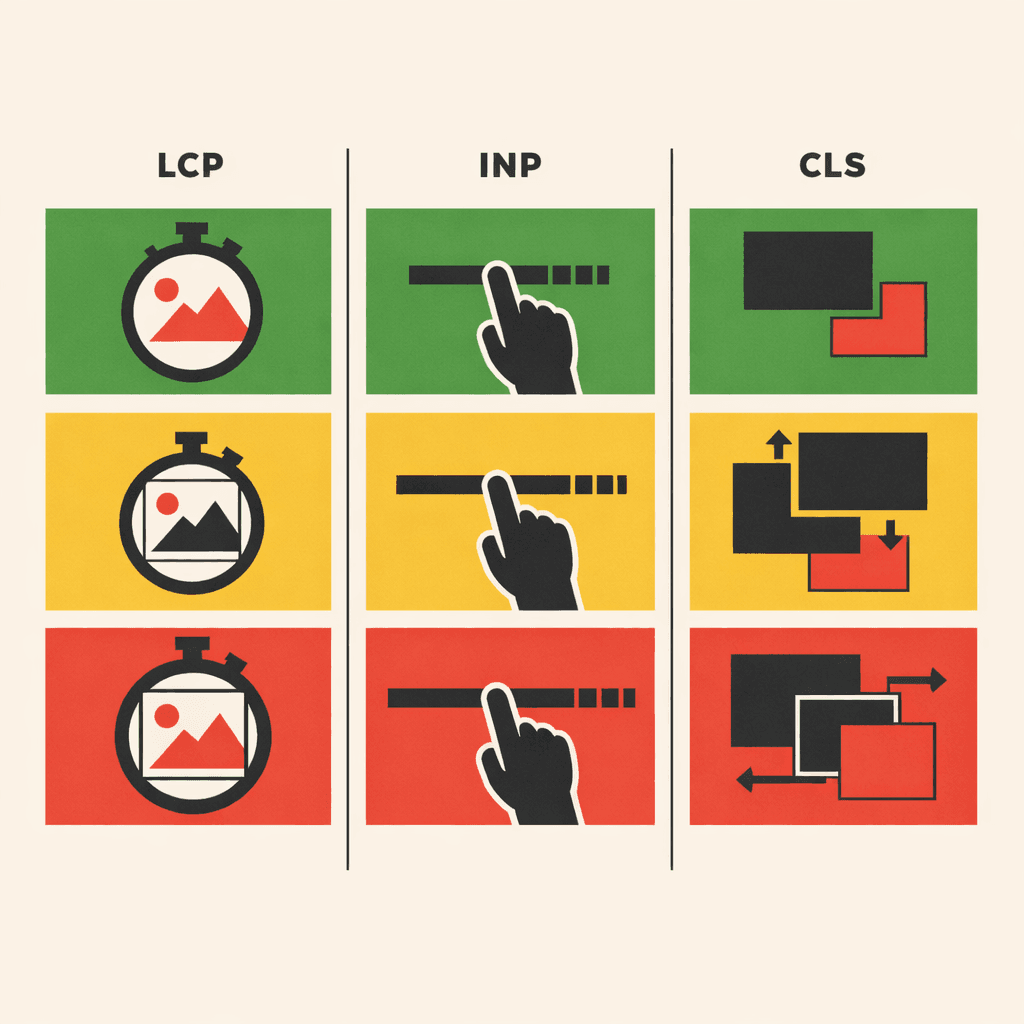
Core Web Vitals 2026: LCP, INP, and CLS Thresholds Explained
Core Web Vitals remain a confirmed Google ranking signal in 2026. This guide breaks down the exact LCP, INP, and CLS thresholds, what causes failures, and the fastest fixes to reach 'Good' scores.
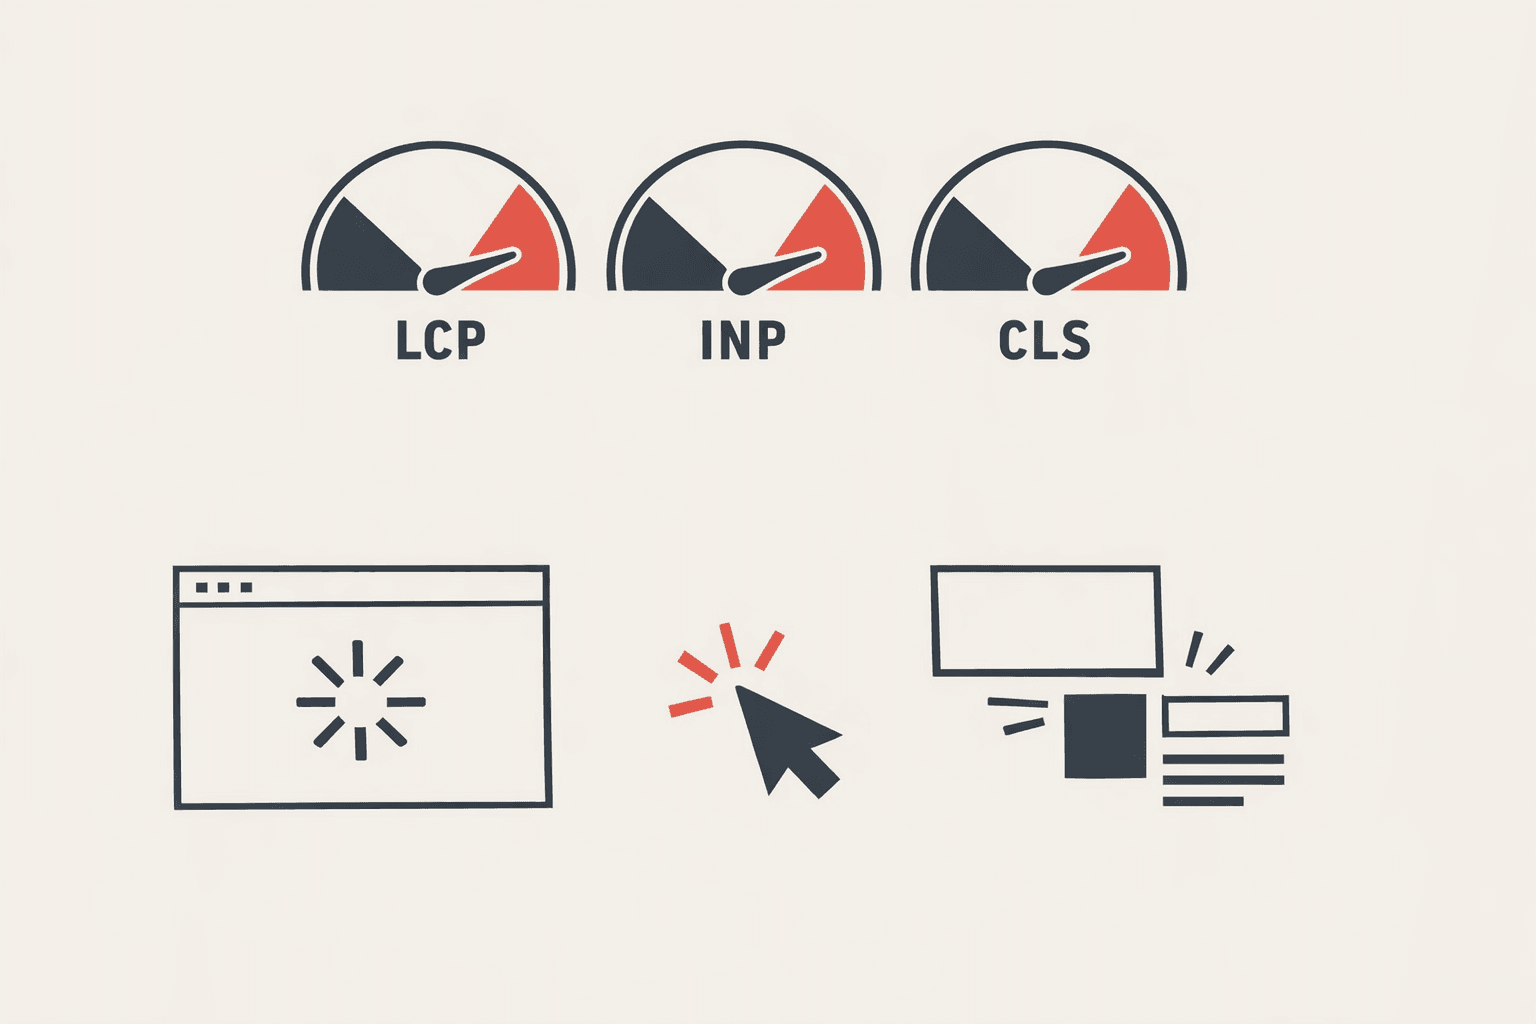
Core Web Vitals are Google's three user-experience metrics used as a ranking signal. In 2026, the metrics are LCP (Largest Contentful Paint), INP (Interaction to Next Paint), and CLS (Cumulative Layout Shift). Hitting the "Good" threshold on all three correlates directly with better search visibility and lower bounce rates.
What Are Core Web Vitals?#
Core Web Vitals are a subset of Google's Page Experience signals. Each metric quantifies a distinct dimension of how real users perceive a page: loading speed, interaction responsiveness, and visual stability. Google measures them using field data collected from Chrome users and surfaces the results in Search Console, PageSpeed Insights, and the Chrome UX Report (CrUX).
What Is the LCP Threshold in 2026?#
LCP measures how long it takes for the largest visible content element — typically a hero image, a large text block, or a video poster — to render on screen. The thresholds are:
- Good: ≤ 2.5 seconds
- Needs Improvement: 2.5 s – 4.0 s
- Poor: > 4.0 seconds
These thresholds have not changed since LCP entered Core Web Vitals, and Google has signalled no revision for 2026. The 2.5-second bar is deliberately aggressive: it pushes sites to serve optimized images, use a fast CDN, and eliminate render-blocking resources.
What causes a slow LCP?
The most common LCP killers are:
- Unoptimized hero images — large PNGs or JPEGs served without modern formats like WebP or AVIF.
- Render-blocking resources — synchronous scripts or CSS that delay the browser's first paint.
- Slow server response (TTFB) — a Time to First Byte above ~600 ms eats directly into LCP time.
- Lazy-loading the LCP element —
loading="lazy"on the hero image defers the most important asset. - No preload hint — failing to use
<link rel="preload">for the LCP image.
How to fix LCP
- Identify the LCP element using PageSpeed Insights or Chrome DevTools' "Largest Contentful Paint" section.
- Convert the image to WebP or AVIF and serve it at the correct display size.
- Add
<link rel="preload" as="image">for the LCP image in the<head>. - Move to a host or CDN with a TTFB under 200 ms at the 75th percentile.
- Remove or defer any render-blocking scripts above the fold.
What Is the INP Threshold in 2026?#
INP replaced First Input Delay (FID) as a Core Web Vital in March 2024 and remains the interactivity metric in 2026. INP measures the latency of all user interactions — clicks, taps, and keyboard events — throughout the entire page lifecycle, then reports the worst-case value at the 98th percentile.
- Good: ≤ 200 milliseconds
- Needs Improvement: 201 ms – 500 ms
- Poor: > 500 milliseconds
Unlike FID, which only measured the first interaction, INP penalises any sluggish interaction during a visit. This makes it far more representative of real user frustration.
What causes a high INP?
- Long tasks on the main thread — JavaScript that blocks the main thread for more than 50 ms delays input processing.
- Heavy event handlers — onClick or onChange listeners that trigger expensive DOM updates.
- Third-party scripts — analytics, chat widgets, and ad scripts that compete for main-thread time.
- Hydration cost in SPAs — React, Vue, or Angular sites that rehydrate large component trees on load.
How to fix INP
- Open Chrome DevTools → Performance panel → record an interaction and identify long tasks.
- Break long tasks into smaller chunks using
scheduler.yield()orsetTimeout(..., 0)to yield to the browser. - Audit third-party scripts with the Coverage and Network panels; defer or remove non-critical ones.
- Use
startTransition(React) or equivalent framework APIs to deprioritise non-urgent state updates. - Minimise DOM size — pages with tens of thousands of nodes have slower style recalculation after every interaction.
What Is the CLS Threshold in 2026?#
CLS measures unexpected visual shifts — elements jumping around as the page loads. It is scored as a unitless aggregate of all layout shifts not caused by user input.
- Good: ≤ 0.1
- Needs Improvement: 0.1 – 0.25
- Poor: > 0.25
A CLS of 0.1 may sound abstract, but in practice it means the combined impact of shifts must be small relative to the viewport. A single large banner or an unsized image can push a page into the "Poor" band instantly.
What causes high CLS?
- Images without
widthandheightattributes — the browser cannot reserve space before the image loads. - Dynamically injected content — ads, cookie banners, or newsletter popups that push content down.
- Web fonts causing FOUT/FOIT — font swaps that change line lengths and reflow text blocks.
- Late-loading embeds — iframes for YouTube or Twitter that don't have a reserved aspect-ratio container.
How to fix CLS
- Always specify
widthandheighton<img>tags, or useaspect-ratioin CSS. - Reserve space for ad slots with a min-height container even before the ad loads.
- Use
font-display: optionalor preload critical web fonts to prevent late swaps. - Wrap iframes in a CSS aspect-ratio container (
padding-toptrick oraspect-ratio: 16/9). - Avoid inserting content above existing content after the initial load.
How Are Core Web Vitals Measured?#
Google uses field data (real-user measurements from CrUX) as the ranking signal, not lab data. PageSpeed Insights shows both, but only field data affects rankings. A page needs to pass all three metrics at the 75th percentile of page loads to be considered "Good" for Page Experience.
Lab tools — Lighthouse, WebPageTest — are invaluable for diagnosis but cannot substitute for CrUX data. If CrUX has insufficient traffic for a URL, Google aggregates at the origin level.
How to Monitor Core Web Vitals at Scale#
For sites with hundreds or thousands of pages, manual checking is impractical. The right approach:
- Search Console → Core Web Vitals report — grouped view of Good / Needs Improvement / Poor URLs by metric.
- CrUX API or BigQuery — pull raw field data programmatically for custom dashboards.
- Real User Monitoring (RUM) — libraries like
web-vitals.jssend LCP, INP, and CLS from real sessions to your analytics. - Automated audits — tools like SeoChatAI can surface Core Web Vitals issues alongside technical SEO, accessibility, and AI-readiness audits in a single pass.
Does Passing Core Web Vitals Guarantee Better Rankings?#
Passing all three metrics at the "Good" threshold is a necessary but not sufficient condition for top rankings. Core Web Vitals are a tiebreaker signal: when content quality, relevance, and authority are equal, the page with better experience signals will rank higher. Google has never disclosed the exact weight, but the signal is real and documented in their ranking systems documentation.
The practical takeaway: fix Core Web Vitals to eliminate a ranking floor, then focus on content and authority to break through it.
Core Web Vitals and AI Search in 2026#
As AI-generated overviews (formerly SGE) now appear in Google Search results, page experience signals influence whether a page is cited as a source. Pages that are slow, visually unstable, or unresponsive are less likely to be featured. Running a full site audit through SeoChatAI gives you a combined view of your CWV scores, structured data readiness, and AI-citation eligibility — which is increasingly relevant as AI answer engines overtake traditional blue-link clicks.
Quick Reference: 2026 Core Web Vitals Thresholds#
| Metric | Good | Needs Improvement | Poor |
|---|---|---|---|
| LCP | ≤ 2.5 s | 2.5 s – 4.0 s | > 4.0 s |
| INP | ≤ 200 ms | 201 ms – 500 ms | > 500 ms |
| CLS | ≤ 0.1 | 0.1 – 0.25 | > 0.25 |
All thresholds apply at the 75th percentile of field data. A single page with a handful of very slow loads can pull the aggregate into "Poor" territory — which is why percentile-level monitoring matters more than median scores.